The Utility of Infographics
There are two popular web applications for creating an infographics, there is Easel.ly and there is Piktochart. Both have marvelous easy-to-use and easy-to-follow templates. Both are also shareable in the web or in social media channels. But why bother create an infographics?
Infographics is a new type of resource material that is compact, comprehensive, summarizes and simplifies results and aids in understanding a set of facts and details. Many teachers or trainers or even instructional designers should realize that infographics as a new type of resource material can be very useful to send the message they want to tell. They do not have to put all the information and details as they do in their old Powerpoint materials. The audience or the learners themselves can pull the information they need about a topic from various online sources while they read and understand the point the teacher or trainer wants to send across in an infographic.
Other materials that can be created through infographics are: Timelines, Process flows, Visualized data, Comparative or VS infographics, Research infographics or even, Photo infographics.
Here are some examples of infographic resource materials that I use for presentation or as a reference material. See how to use and present them through a web link or simply use the jpg or png material.
Why Use a Gmail and a Google Drive https://magic.piktochart.com/output/13863608-public-why-use-gmail-and-gdrive
Learning English through Songs https://magic.piktochart.com/output/14166479-english-through-songs
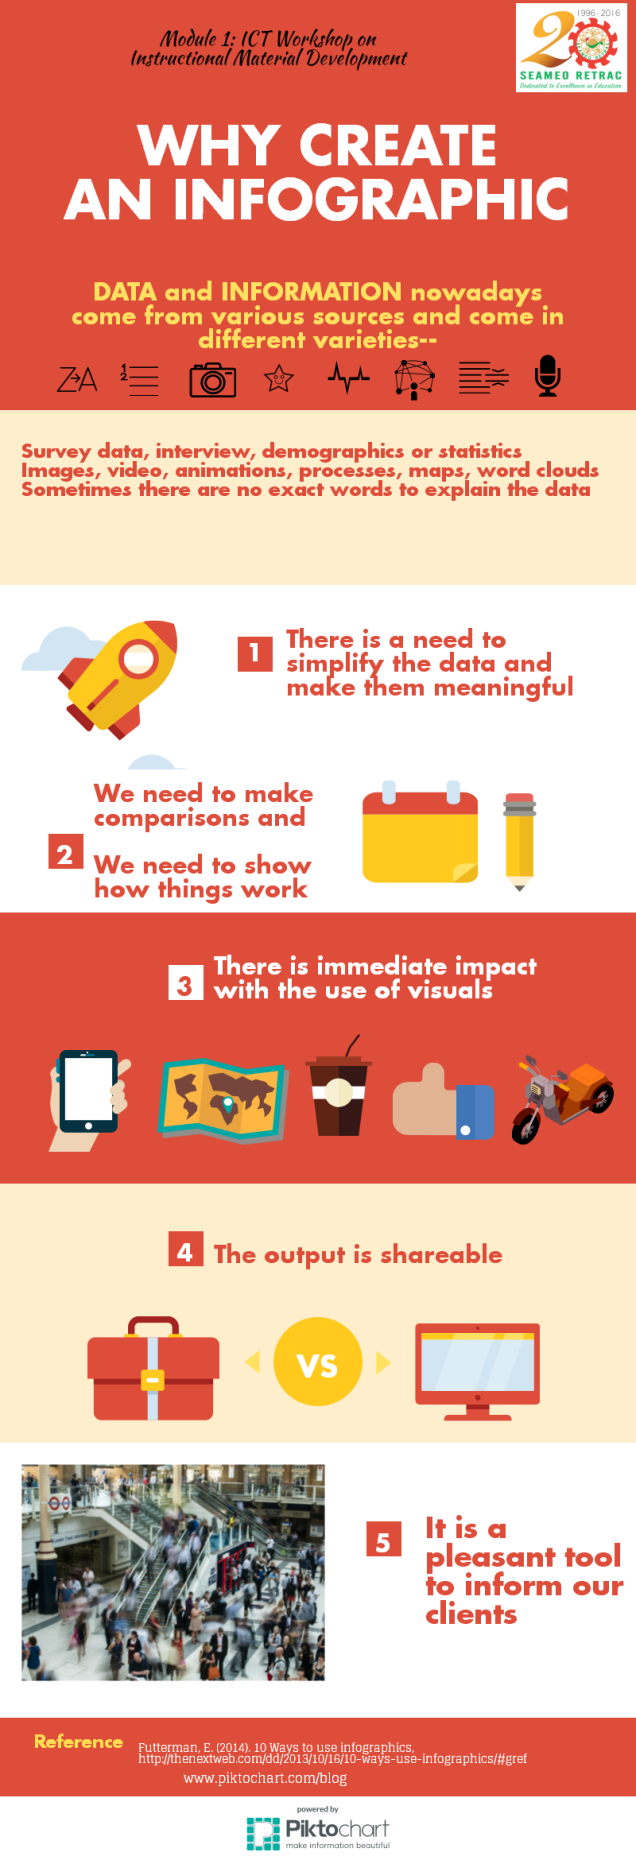
Why create an Infographic